
Sometimes I use Illustrator to make quick charts and graphs for infographics I'm building. Here's a quick way to create donut charts and keep the data intact within Illustrator — which allows me to edit at will.
- Create a pie chart using the Pie Graph Tool (J)
- Use the Direct Selection tool (A) to select and enhance portions of the pie chart. In my case, I created a color gradient using red and dark red. I'm using gray for the part I want to deemphasize.
- After I'm satisfied with the results I want to turn this into a donut chart. So, create a circle using the shape tool (M) that is slightly larger than my pie chart. Make the fill none.
- Then add a stroke that is aligned to the interior (Align Stroke to Inside) of the circle (rather than the default center of the circle edge).
- Make the stroke thick enough to create the donut shape you want.
- With the circle highlighted, hit Expand the Appearance to expand the stroke into shapes. This will be your mask for the pie chart.
- Select the circle and pie chart (which is beneath the donut shape), and hit the Clipping Mask function (Command+7). Now you have a editable donut pie chart.
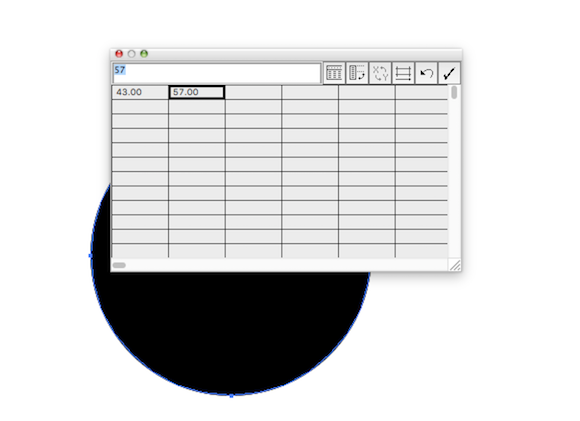
- Whenever you want to change the pie chart numbers just select your pie chart in isolation mode, or using your Layers panel.
- Select Data and make your edits.


No comments:
Post a Comment
Feel free to comment. But comments with links will be deleted (unless truly helpful).